Differential Expression: Advanced Analysis
This tutorial explores advanced differential expression (DE) analysis with Kompot, building on the Getting Started tutorial.
You’ll learn how to:
Customize DE analysis parameters for your specific dataset
Work with null gene distributions for FDR estimation
Perform multiple comparisons and track results
Use advanced visualization options
Optimize computational resources
Setup
[1]:
import anndata as ad
import matplotlib.pyplot as plt
import numpy as np
import palantir
import pandas as pd
import scanpy as sc

import kompot

plt.rcParams["axes.spines.right"] = False
plt.rcParams["axes.spines.top"] = False
plt.rcParams["image.cmap"] = "Spectral_r"
[2]:
DATA_PATH = "../data/murine_bone_marrow_aging.h5ad"
GROUPING_COLUMN = "Age"
CONDITIONS = ["Young", "Old"]
CELL_TYPE_COLUMN = "highres_celltype"
DIMENSIONALITY_REDUCTION = "X_pca_harmony"
LAYER_FOR_EXPRESSION = "logged_counts"
Load and Prepare Data
We’ll reuse the dataset from the first tutorial:
[3]:
adata = ad.read_h5ad(DATA_PATH)
palantir.utils.run_diffusion_maps(adata, pca_key="X_pca_harmony", n_components=40)
adata
/fh/fast/setty_m/user/dotto/kompot/.venv/lib/python3.12/site-packages/joblib/externals/loky/backend/context.py:131: UserWarning: Could not find the number of physical cores for the following reason:
found 0 physical cores < 1
Returning the number of logical cores instead. You can silence this warning by setting LOKY_MAX_CPU_COUNT to the number of cores you want to use.
  warnings.warn(
  File "/fh/fast/setty_m/user/dotto/kompot/.venv/lib/python3.12/site-packages/joblib/externals/loky/backend/context.py", line 255, in _count_physical_cores
    raise ValueError(f"found {cpu_count_physical} physical cores < 1")
[3]:
AnnData object with n_obs × n_vars = 8090 × 16285
    obs: 'Compartment', 'Replicate', 'Age', 'Sample', 'Info', 'batch', 'doublet_score', 'n_genes_by_counts', 'total_counts', 'total_counts_mt', 'pct_counts_mt', 'total_counts_hb', 'pct_counts_hb', 'S_score', 'G2M_score', 'phase', 'leiden', 'phenograph', 'highres_celltype', 'midres_celltype'
    var: 'gene_ids', 'feature_types', 'genome', 'mt', 'n_cells_by_counts', 'mean_counts', 'pct_dropout_by_counts', 'total_counts', 'hb', 'highly_variable', 'means', 'dispersions', 'dispersions_norm', 'highly_variable_nbatches', 'highly_variable_intersection'
    uns: 'Age_colors', 'Compartment_colors', 'DMEigenValues', 'Info_colors', 'README', 'Replicate_colors', 'Sample_colors', 'batch_colors', 'draw_graph', 'highres_celltype_colors', 'hvg', 'leiden', 'leiden_colors', 'midres_celltype_colors', 'neighbors', 'pca', 'phase_colors', 'umap', 'DM_EigenValues'
    obsm: 'AbCapture', 'DM_EigenVectors', 'HTO', 'X_draw_graph_fa', 'X_pca', 'X_pca_harmony', 'X_pca_noregression', 'X_umap'
    varm: 'PCs'
    layers: 'MAGIC_imputed_data', 'logged_counts', 'normalized_counts', 'raw_counts'
    obsp: 'DM_Kernel', 'connectivities', 'distances', 'DM_Similarity'
Understanding DE Parameters
The kompot.de function accepts settings dataclasses for grouped parameter control:
GP Settings (kompot.GPSettings)
``sigma``: Noise level in the expression layer (default: 1)
Adjust based on your normalization method
Higher values for noisier data
Lower values for denoised data
``n_landmarks``: Number of landmark points for Mahalanobis computation (default: 5000)
More landmarks = more accurate but slower
Kompot automatically uses min(n_landmarks, n_cells)
FDR Settings (kompot.FDRSettings)
``null_genes``: Number of permuted genes for FDR estimation (default: “auto” → 2000)
Higher values give better FDR estimates but increase computation time
Set to 0 to disable FDR computation
``threshold``: FDR threshold for the
is_decolumn (default: 0.05)
Storage Settings (kompot.StorageSettings)
``result_key``: Prefix for result field names (default: “kompot_de”)
Change to avoid overwriting previous results
Let’s run DE analysis with customized parameters:
[4]:
de_results = kompot.de(
    adata,
    groupby=GROUPING_COLUMN,
    condition1=CONDITIONS[0],
    condition2=CONDITIONS[1],
    layer=LAYER_FOR_EXPRESSION,
    obsm_key=DIMENSIONALITY_REDUCTION,
    gp=kompot.GPSettings(batch_size=0),  # 0 = all cells at once; increase for lower memory
    fdr=kompot.FDRSettings(null_genes=4000),
)
[2026-03-26 05:37:46,558] [INFO    ] Condition 1 (Young): 2,917 cells
[2026-03-26 05:37:46,558] [INFO    ] Condition 2 (Old): 3,116 cells
[2026-03-26 05:37:55,958] [INFO    ] Fitting expression estimator for condition 1...
[2026-03-26 05:38:15,072] [INFO    ] Fitting expression estimator for condition 2...
[2026-03-26 05:38:59,824] [INFO    ] FDR analysis complete: 879/16285 genes significantly DE at FDR < 0.05
[2026-03-26 05:38:59,826] [INFO    ] Mahalanobis distance threshold for FDR < 0.05: 10.4591
[2026-03-26 05:39:04,550] [INFO    ] This run will have `run_id=0`.
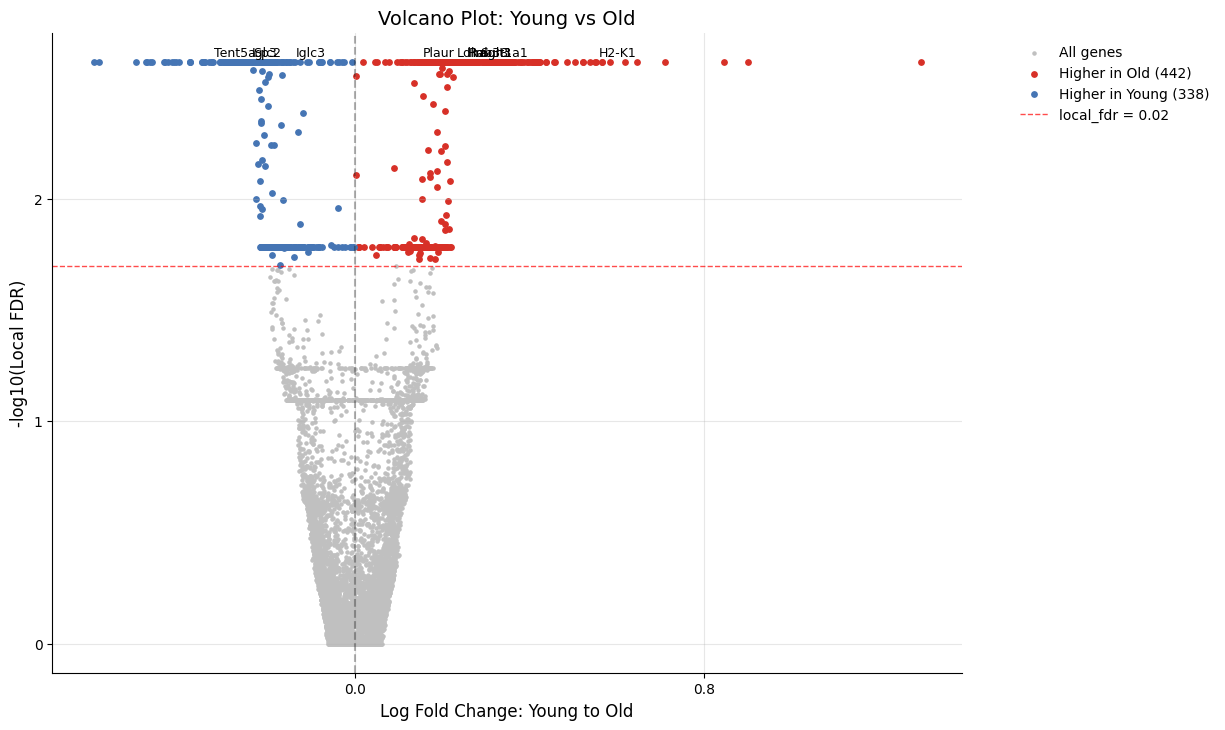
Volcano Plot Customization
The volcano_de function offers extensive customization options.
Changing the Y-Axis Metric
By default, the y-axis shows Mahalanobis distance. You can switch to local FDR:
[5]:
kompot.plot.volcano_de(
    adata,
    y_axis_type="local_fdr",
    significance_threshold=0.02,  # Adjust FDR threshold
)
[2026-03-26 05:39:04,989] [INFO    ] Found DE run info for run_id=-1
[2026-03-26 05:39:04,991] [INFO    ] Found mean_lfc_key='kompot_de_Young_to_Old_mean_lfc' from run info
[2026-03-26 05:39:04,992] [INFO    ] Found mahalanobis_key='kompot_de_Young_to_Old_mahalanobis' from run info
[2026-03-26 05:39:04,993] [INFO    ] Successfully inferred fields: {'mean_lfc_key': 'kompot_de_Young_to_Old_mean_lfc', 'mahalanobis_key': 'kompot_de_Young_to_Old_mahalanobis'}
[2026-03-26 05:39:04,994] [INFO    ] Using local_fdr values for y-axis: kompot_de_Young_to_Old_mahalanobis_local_fdr
[2026-03-26 05:39:04,995] [INFO    ] Using DE run 0: comparing Young to Old
[2026-03-26 05:39:05,024] [INFO    ] Using data columns from var - lfc: 'kompot_de_Young_to_Old_mean_lfc', score: 'kompot_de_Young_to_Old_mahalanobis_local_fdr'
[2026-03-26 05:39:05,025] [INFO    ] Applied local_fdr transformation to y-axis data
[2026-03-26 05:39:05,026] [INFO    ] Significance threshold selection: using column 'kompot_de_Young_to_Old_mahalanobis_local_fdr' with threshold < 0.02
[2026-03-26 05:39:05,027] [INFO    ] Values range: 0.002420 - 1.000000
[2026-03-26 05:39:05,028] [INFO    ] Found 780 genes with local_fdr < 0.02
[2026-03-26 05:39:05,032] [INFO    ] Highlighting 780 genes at local_fdr < 0.02 (442 up, 338 down)
[2026-03-26 05:39:05,047] [INFO    ] Labeling top 10 genes by score
[2026-03-26 05:39:05,052] [INFO    ] Added local_fdr threshold line at y=1.70 (local_fdr=0.02)
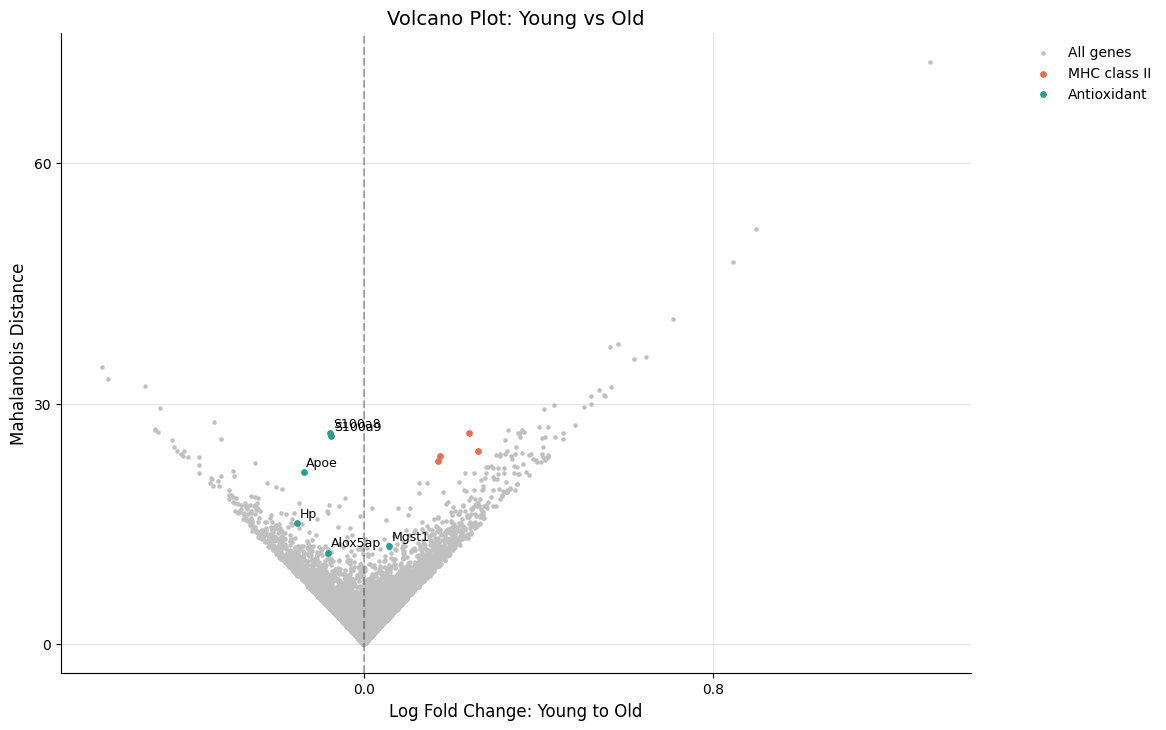
Highlighting Gene Sets
Highlight specific gene sets with custom colors and labels:
[6]:
# Define gene sets of interest
gene_sets = [
    {
        "name": "MHC class II",
        "genes": ["H2-Ab1", "H2-Aa", "Cd74", "H2-Eb1"],
        "color": "#E76F51",
    },
    {
        "name": "Antioxidant",
        "genes": ["S100a8", "Alox5ap", "Hp", "S100a9", "Mgst1", "Apoe"],
        "color": "#2A9D8F",
    },
]

kompot.plot.volcano_de(
    adata,
    significance_threshold={"local_fdr": 0.02, "mahalanobis": 30},
    gene_labels=["S100a8", "Alox5ap", "Hp", "S100a9", "Mgst1", "Apoe"],
    highlight_genes=gene_sets,
)
[2026-03-26 05:39:05,330] [INFO    ] Found DE run info for run_id=-1
[2026-03-26 05:39:05,331] [INFO    ] Found mean_lfc_key='kompot_de_Young_to_Old_mean_lfc' from run info
[2026-03-26 05:39:05,332] [INFO    ] Found mahalanobis_key='kompot_de_Young_to_Old_mahalanobis' from run info
[2026-03-26 05:39:05,337] [INFO    ] Successfully inferred fields: {'mean_lfc_key': 'kompot_de_Young_to_Old_mean_lfc', 'mahalanobis_key': 'kompot_de_Young_to_Old_mahalanobis'}
[2026-03-26 05:39:05,338] [INFO    ] Using DE run 0: comparing Young to Old
[2026-03-26 05:39:05,347] [INFO    ] Using data columns from var - lfc: 'kompot_de_Young_to_Old_mean_lfc', score: 'kompot_de_Young_to_Old_mahalanobis'
[2026-03-26 05:39:05,349] [INFO    ] Added highlight group 'MHC class II' with 4 genes
[2026-03-26 05:39:05,350] [INFO    ] Added highlight group 'Antioxidant' with 6 genes
[2026-03-26 05:39:05,360] [INFO    ] Labeling 6 specific genes
[2026-03-26 05:39:05,365] [INFO    ] Skipping threshold line drawing for dictionary-format significance_threshold
gene_labels can be:
A list of gene names
A dictionary mapping gene names to custom labels
An integer to auto-select the top N genes
highlight_genes can be:
A list of gene names (all same color)
A list of dictionaries with “name”, “genes”, and “color” keys (as shown)
An integer to highlight the top N genes
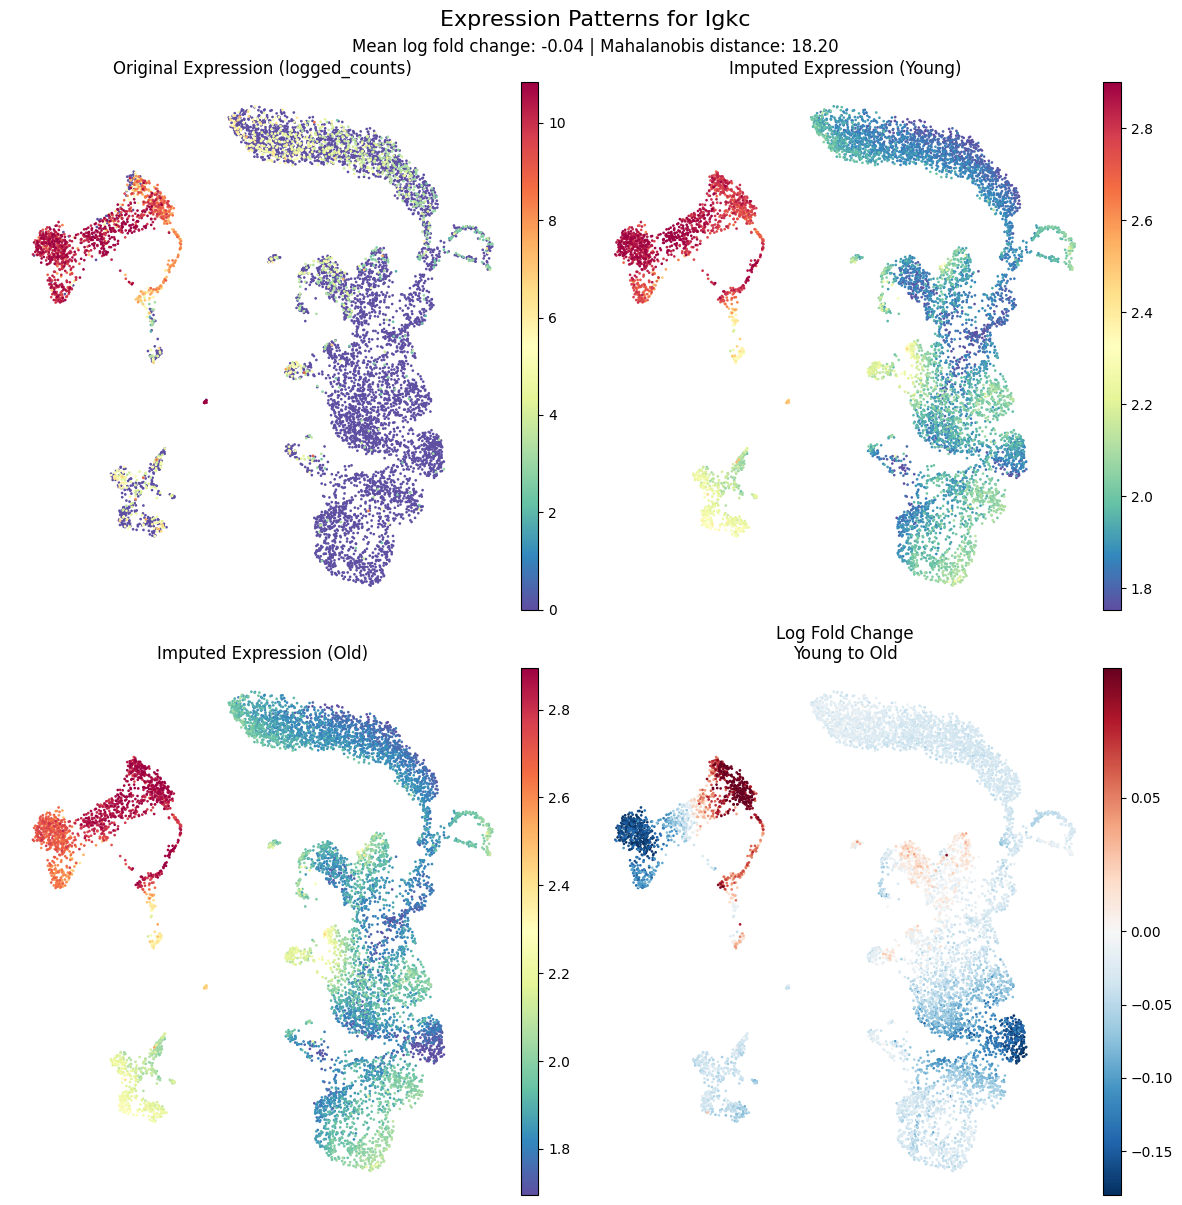
Plotting Individual Genes
Imputed expression for each condition is stored in adata.layers:
kompot_de_Young_imputedkompot_de_Old_imputedkompot_de_Young_to_Old_fold_change
You can plot these manually:
gene = "Igkc"

# Manual plotting
sc.pl.embedding(adata, basis="umap", color=gene, layer="logged_counts")
sc.pl.embedding(adata, basis="umap", color=gene, layer="kompot_de_Young_imputed")
sc.pl.embedding(adata, basis="umap", color=gene, layer="kompot_de_Old_imputed")
sc.pl.embedding(adata, basis="umap", color=gene, layer="kompot_de_Young_to_Old_fold_change")
Or use the convenience function:
[7]:
kompot.plot.plot_gene_expression(
    adata, gene="Igkc", vmin="p2", vmax="p98", frameon=False
)
[2026-03-26 05:39:05,582] [INFO    ] Found DE run info for run_id=-1
[2026-03-26 05:39:05,583] [INFO    ] Found mean_lfc_key='kompot_de_Young_to_Old_mean_lfc' from run info
[2026-03-26 05:39:05,584] [INFO    ] Found mahalanobis_key='kompot_de_Young_to_Old_mahalanobis' from run info
[2026-03-26 05:39:05,585] [INFO    ] Successfully inferred fields: {'mean_lfc_key': 'kompot_de_Young_to_Old_mean_lfc', 'mahalanobis_key': 'kompot_de_Young_to_Old_mahalanobis'}
[2026-03-26 05:39:05,586] [INFO    ] Using DE run 0: comparing Young to Old
[2026-03-26 05:39:05,587] [INFO    ] Using fields for gene expression plot - lfc_key: 'kompot_de_Young_to_Old_mean_lfc', score_key: 'kompot_de_Young_to_Old_mahalanobis'
[2026-03-26 05:39:05,587] [INFO    ] Using layer 'logged_counts' inferred from run information
[2026-03-26 05:39:05,590] [INFO    ] Using imputed layer 'kompot_de_Young_imputed' for 'Young'
[2026-03-26 05:39:05,592] [INFO    ] Using imputed layer 'kompot_de_Old_imputed' for 'Old'
[2026-03-26 05:39:05,593] [INFO    ] Using fold_change layer 'kompot_de_Young_to_Old_fold_change' from run_info
Comparing Conditions with Subplots
The kompot.plot.embedding wrapper supports filtering to specific groups:
[8]:
kompot.plot.embedding(
    adata,
    "umap",
    color="Igkc",
    layer=LAYER_FOR_EXPRESSION,
    frameon=False,
    mgroups=[{GROUPING_COLUMN: condition} for condition in CONDITIONS],
)
[2026-03-26 05:39:06,406] [INFO    ] Selected 2,917 cells out of 8,090 total cells.
[2026-03-26 05:39:06,512] [INFO    ] Selected 3,116 cells out of 8,090 total cells.
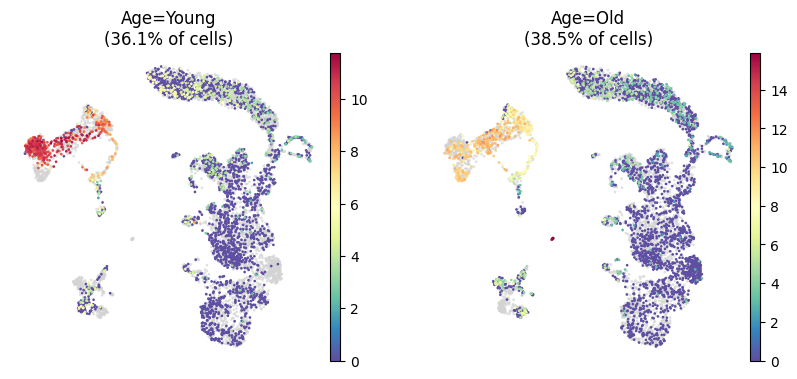
The mgroups parameter creates multiple subplots, each showing cells filtered by the specified conditions.
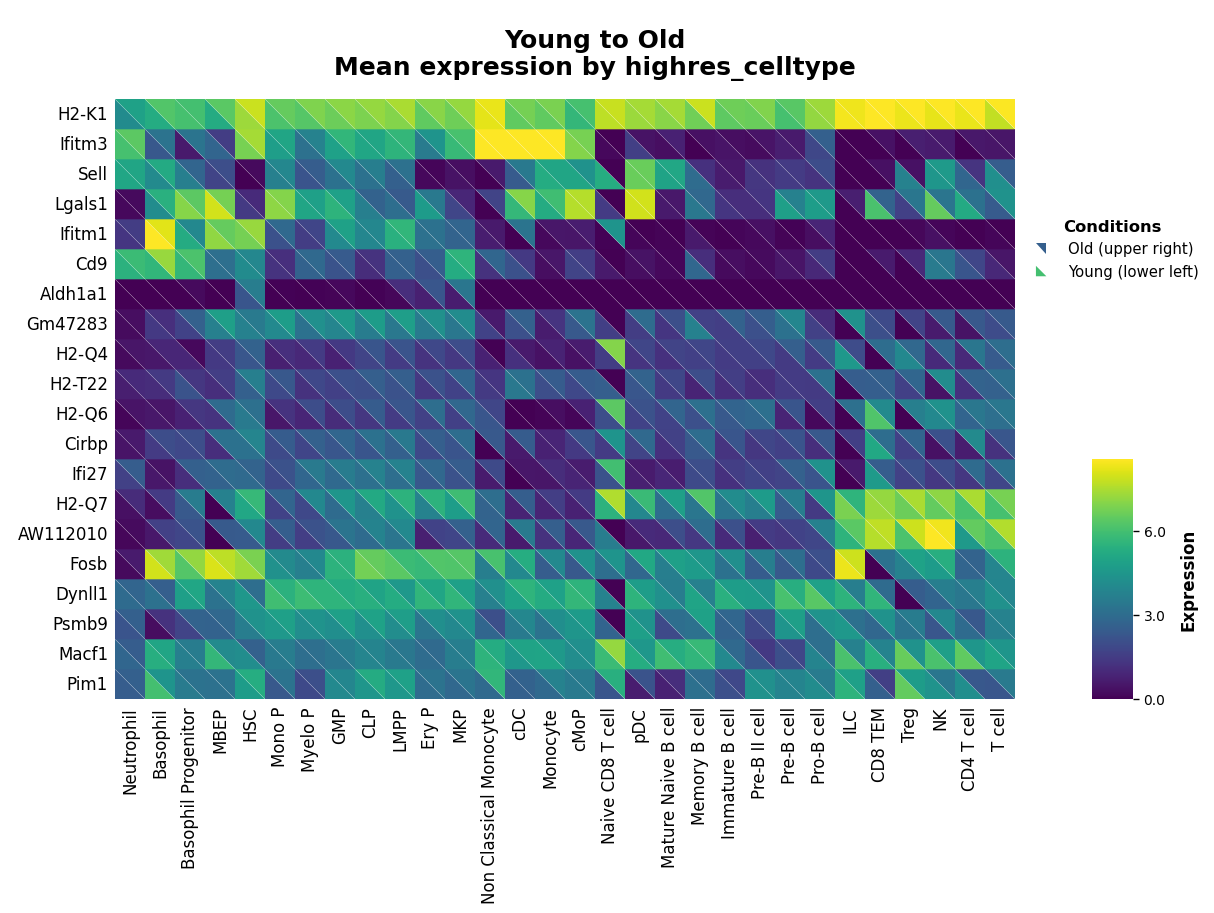
Heatmap Customization
The heatmap function visualizes average expression per group.
Z-Score Normalization
By default, values are z-scored across conditions for each gene. Disable this to show raw expression:
[9]:
kompot.plot.heatmap(
    adata,
    n_top_genes=20,
    groupby=CELL_TYPE_COLUMN,
    exclude_groups="Plasma cell",
    standard_scale=None,  # Disable z-scoring
    vmax="p99",
)
[2026-03-26 05:39:06,875] [INFO    ] Found DE run info for run_id=-1
[2026-03-26 05:39:06,876] [INFO    ] Found mahalanobis_key='kompot_de_Young_to_Old_mahalanobis' from run info
[2026-03-26 05:39:06,879] [INFO    ] Successfully inferred fields: {'mahalanobis_key': 'kompot_de_Young_to_Old_mahalanobis'}
[2026-03-26 05:39:06,880] [INFO    ] Using DE run 0 for heatmap.
[2026-03-26 05:39:06,881] [INFO    ] Inferred score_key='kompot_de_Young_to_Old_mahalanobis' from run information
[2026-03-26 05:39:06,887] [INFO    ] Inferred condition_column='Age' from run information
[2026-03-26 05:39:06,888] [INFO    ] Inferred condition1='Young' from run information
[2026-03-26 05:39:06,888] [INFO    ] Inferred condition2='Old' from run information
[2026-03-26 05:39:06,889] [INFO    ] Inferred layer='logged_counts' from run information
[2026-03-26 05:39:06,889] [INFO    ] Creating split heatmap with 20 genes/features
[2026-03-26 05:39:06,890] [INFO    ] Using expression data from layer: 'logged_counts'
[2026-03-26 05:39:06,967] [INFO    ] Excluded 7 cells from groups: Plasma cell
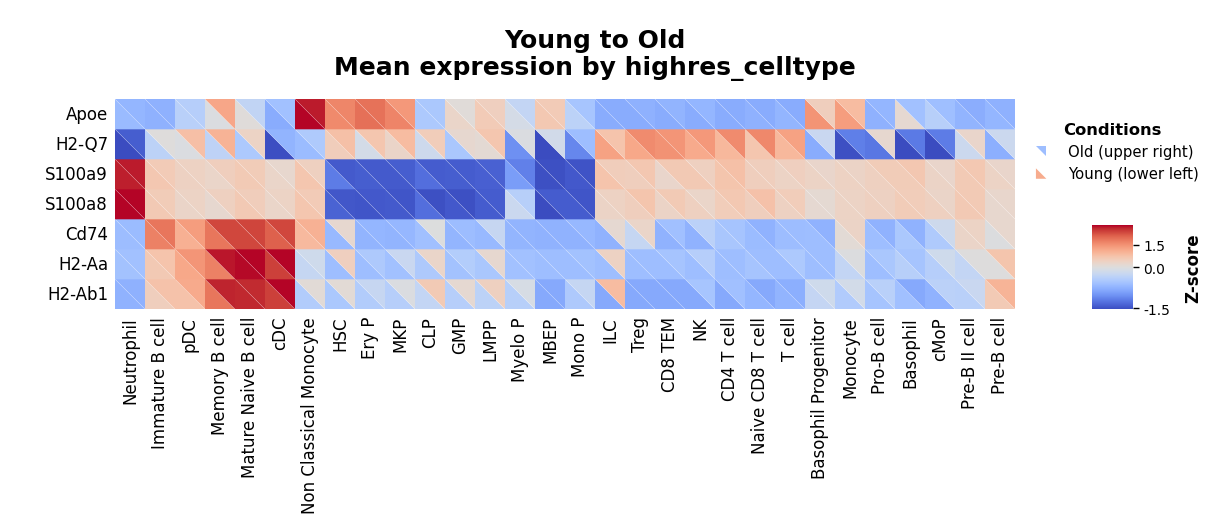
Custom Gene Lists
Instead of selecting top genes by Mahalanobis distance, provide a custom list:
[10]:
custom_genes = ["H2-Q7", "Cd74", "H2-Aa", "H2-Ab1", "S100a9", "S100a8", "Apoe"]

kompot.plot.heatmap(
    adata,
    genes=custom_genes,
    groupby=CELL_TYPE_COLUMN,
    exclude_groups="Plasma cell",
    vmin="p1",
    vmax="p99",
)
[2026-03-26 05:39:08,550] [INFO    ] Inferred condition_column='Age' from run information
[2026-03-26 05:39:08,551] [INFO    ] Inferred condition1='Young' from run information
[2026-03-26 05:39:08,552] [INFO    ] Inferred condition2='Old' from run information
[2026-03-26 05:39:08,553] [INFO    ] Inferred layer='logged_counts' from run information
[2026-03-26 05:39:08,554] [INFO    ] Creating split heatmap with 7 genes/features
[2026-03-26 05:39:08,555] [INFO    ] Using expression data from layer: 'logged_counts'
[2026-03-26 05:39:08,620] [INFO    ] Excluded 7 cells from groups: Plasma cell
[2026-03-26 05:39:08,626] [INFO    ] Applying gene-wise z-scoring (standard_scale='var')
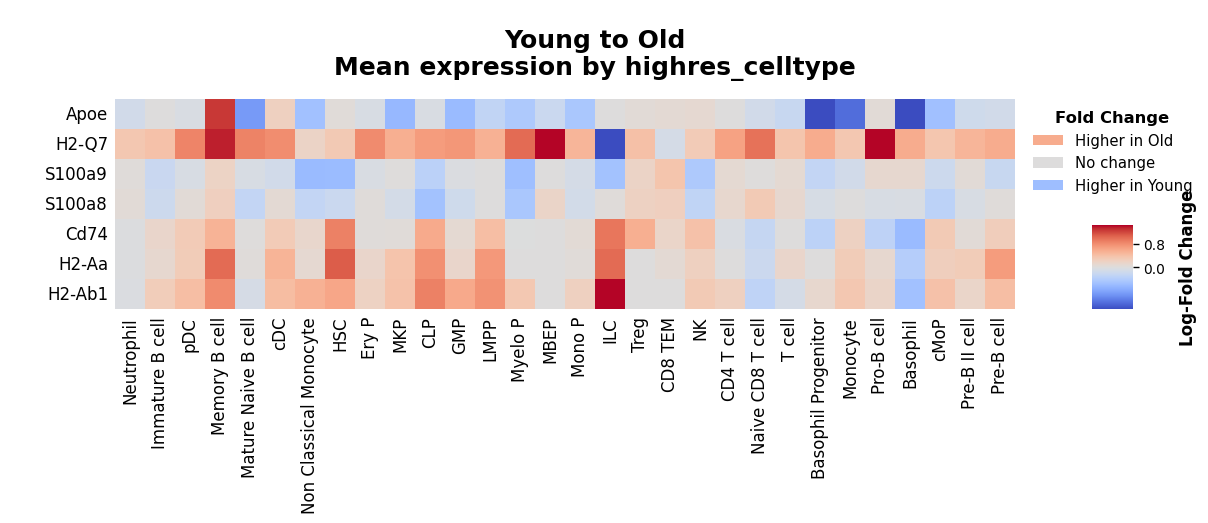
Simplify Heatmap Display
To simplify the plot, pass fold_change_mode=True. Each square will then represent only the difference between the two groups, which equals the log fold change if the expression data was log-transformed.
[11]:
kompot.plot.heatmap(
    adata,
    genes=custom_genes,
    groupby=CELL_TYPE_COLUMN,
    exclude_groups="Plasma cell",
    vmin="p1",
    vmax="p99",
    fold_change_mode=True,
)
[2026-03-26 05:39:09,262] [INFO    ] Inferred condition_column='Age' from run information
[2026-03-26 05:39:09,264] [INFO    ] Inferred condition1='Young' from run information
[2026-03-26 05:39:09,265] [INFO    ] Inferred condition2='Old' from run information
[2026-03-26 05:39:09,266] [INFO    ] Inferred layer='logged_counts' from run information
[2026-03-26 05:39:09,266] [INFO    ] Creating fold change heatmap with 7 genes/features
[2026-03-26 05:39:09,268] [INFO    ] Using expression data from layer: 'logged_counts'
[2026-03-26 05:39:09,332] [INFO    ] Excluded 7 cells from groups: Plasma cell
[2026-03-26 05:39:09,339] [INFO    ] Applying gene-wise z-scoring (standard_scale='var')
[2026-03-26 05:39:09,383] [WARNING ] standard_scale is ignored in fold_change_mode as z-scoring is not appropriate for fold changes
Multiple Comparisons
Kompot tracks multiple analysis runs, allowing you to perform different comparisons on the same dataset.
Running Additional Comparisons
Let’s add a comparison between Young and Mid-age mice (if Mid exists in your data):
[12]:
de_results_2 = kompot.de(
    adata,
    groupby=GROUPING_COLUMN,
    condition1="Young",
    condition2="Mid",
    layer=LAYER_FOR_EXPRESSION,
    obsm_key=DIMENSIONALITY_REDUCTION,
    gp=kompot.GPSettings(batch_size=0),
)
[2026-03-26 05:39:09,955] [WARNING ] Differential expression results with result_key='kompot_de' already exist in the dataset. Previous run was at 2026-03-26T05:39:04.524253 comparing Young to Old. Fields that will be overwritten: layers.kompot_de_Young_imputed, obs.kompot_de_Young_std Set overwrite=False to prevent overwriting or overwrite=True to silence this message.
[2026-03-26 05:39:09,958] [INFO    ] Condition 1 (Young): 2,917 cells
[2026-03-26 05:39:09,959] [INFO    ] Condition 2 (Mid): 2,057 cells
[2026-03-26 05:39:11,315] [INFO    ] Fitting expression estimator for condition 1...
[2026-03-26 05:39:11,532] [WARNING ] Gaussin process type is GaussianProcessType.FIXED and n_landmarks=5,000 are requested while only 2,917 datapoints are available. Using all datapoints for 2,917 landmarks instead.
[2026-03-26 05:39:13,733] [INFO    ] Fitting expression estimator for condition 2...
[2026-03-26 05:39:16,683] [WARNING ] Gaussin process type is GaussianProcessType.FIXED and n_landmarks=5,000 are requested while only 2,057 datapoints are available. Using all datapoints for 2,057 landmarks instead.
[2026-03-26 05:39:34,348] [INFO    ] FDR analysis complete: 626/16285 genes significantly DE at FDR < 0.05
[2026-03-26 05:39:34,350] [INFO    ] Mahalanobis distance threshold for FDR < 0.05: 10.4155
[2026-03-26 05:39:38,458] [INFO    ] This run will have `run_id=1`.
Kompot warns about field overwrites and tracks which run created each field.
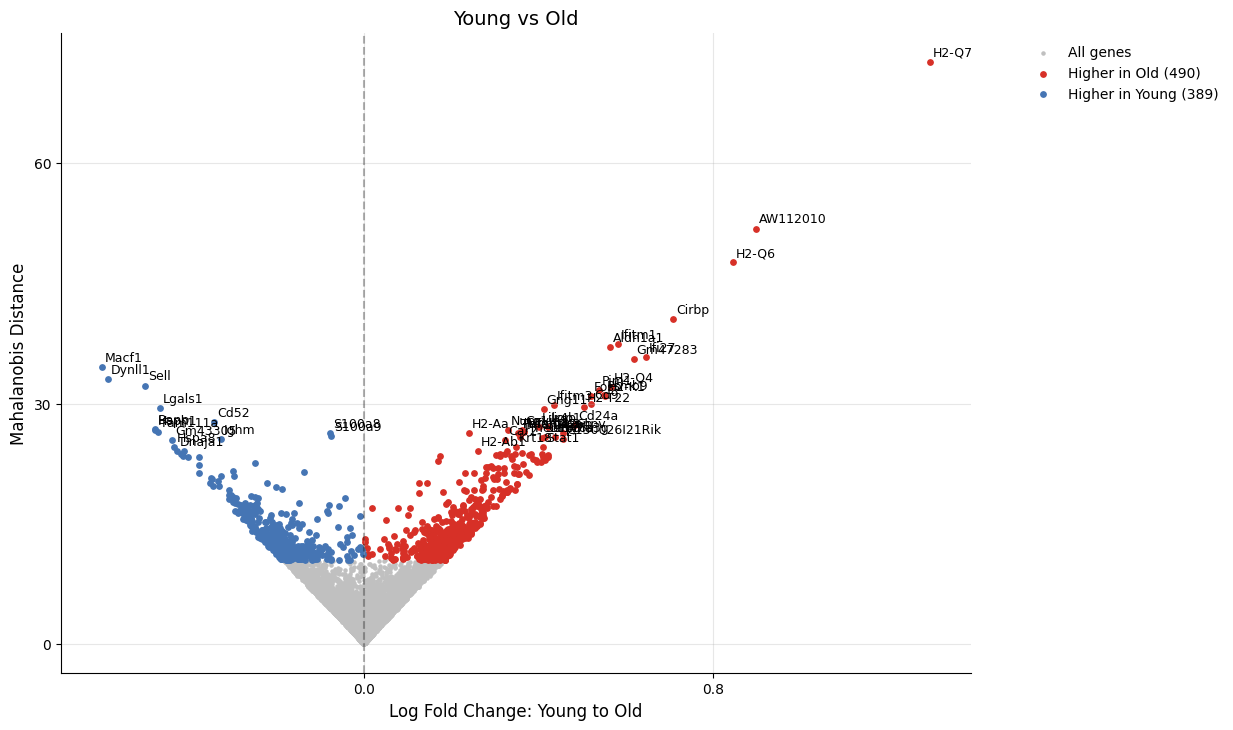
Accessing Different Runs
Each analysis is assigned a run_id (0 for the first run, 1 for the second, etc.). Most plotting functions accept a run_id parameter:
[13]:
# Plot the first comparison (Young vs Old)
kompot.plot.volcano_de(adata, run_id=0, title="Young vs Old", gene_labels=50)
[2026-03-26 05:39:38,694] [INFO    ] Found DE run info for run_id=0
[2026-03-26 05:39:38,695] [INFO    ] Found mean_lfc_key='kompot_de_Young_to_Old_mean_lfc' from run info
[2026-03-26 05:39:38,696] [INFO    ] Found mahalanobis_key='kompot_de_Young_to_Old_mahalanobis' from run info
[2026-03-26 05:39:38,697] [WARNING ] Field 'kompot_de_Young_to_Old_mean_lfc' was last written by run 0, but current context expects run 1. The field may have been overwritten.
[2026-03-26 05:39:38,698] [WARNING ] Field 'kompot_de_Young_to_Old_mahalanobis' was last written by run 0, but current context expects run 1. The field may have been overwritten.
[2026-03-26 05:39:38,699] [INFO    ] Successfully inferred fields: {'mean_lfc_key': 'kompot_de_Young_to_Old_mean_lfc', 'mahalanobis_key': 'kompot_de_Young_to_Old_mahalanobis'}
[2026-03-26 05:39:38,700] [WARNING ] Field inference completed with 2 warnings
[2026-03-26 05:39:38,700] [INFO    ] Using DE run 0: comparing Young to Old
[2026-03-26 05:39:38,710] [INFO    ] Using data columns from var - lfc: 'kompot_de_Young_to_Old_mean_lfc', score: 'kompot_de_Young_to_Old_mahalanobis'
[2026-03-26 05:39:38,716] [INFO    ] Highlighting 879 genes marked as DE (490 up, 389 down)
[2026-03-26 05:39:38,730] [INFO    ] Labeling top 50 genes by score
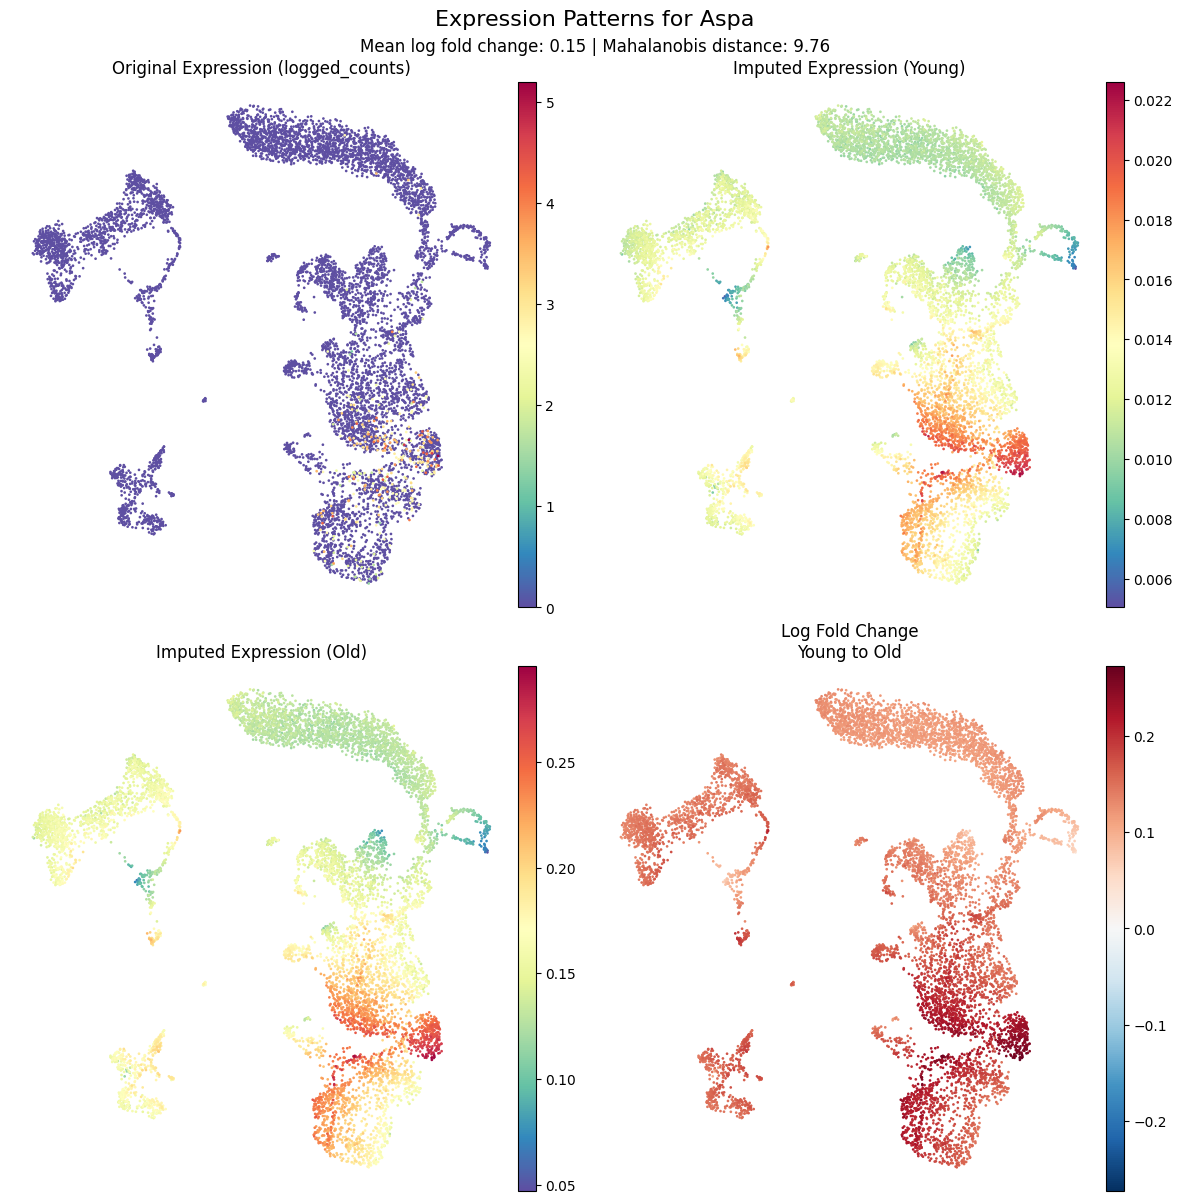
[14]:
kompot.plot.plot_gene_expression(
    adata, run_id=0, gene="Aspa", frameon=False
)
[2026-03-26 05:39:39,103] [INFO    ] Found DE run info for run_id=0
[2026-03-26 05:39:39,104] [INFO    ] Found mean_lfc_key='kompot_de_Young_to_Old_mean_lfc' from run info
[2026-03-26 05:39:39,105] [INFO    ] Found mahalanobis_key='kompot_de_Young_to_Old_mahalanobis' from run info
[2026-03-26 05:39:39,106] [WARNING ] Field 'kompot_de_Young_to_Old_mean_lfc' was last written by run 0, but current context expects run 1. The field may have been overwritten.
[2026-03-26 05:39:39,108] [WARNING ] Field 'kompot_de_Young_to_Old_mahalanobis' was last written by run 0, but current context expects run 1. The field may have been overwritten.
[2026-03-26 05:39:39,108] [INFO    ] Successfully inferred fields: {'mean_lfc_key': 'kompot_de_Young_to_Old_mean_lfc', 'mahalanobis_key': 'kompot_de_Young_to_Old_mahalanobis'}
[2026-03-26 05:39:39,109] [WARNING ] Field inference completed with 2 warnings
[2026-03-26 05:39:39,110] [INFO    ] Using DE run 0: comparing Young to Old
[2026-03-26 05:39:39,110] [INFO    ] Using fields for gene expression plot - lfc_key: 'kompot_de_Young_to_Old_mean_lfc', score_key: 'kompot_de_Young_to_Old_mahalanobis'
[2026-03-26 05:39:39,111] [INFO    ] Using layer 'logged_counts' inferred from run information
[2026-03-26 05:39:39,112] [INFO    ] Using imputed layer 'kompot_de_Young_imputed' for 'Young'
[2026-03-26 05:39:39,113] [INFO    ] Using imputed layer 'kompot_de_Old_imputed' for 'Old'
[2026-03-26 05:39:39,114] [INFO    ] Using fold_change layer 'kompot_de_Young_to_Old_fold_change' from run_info
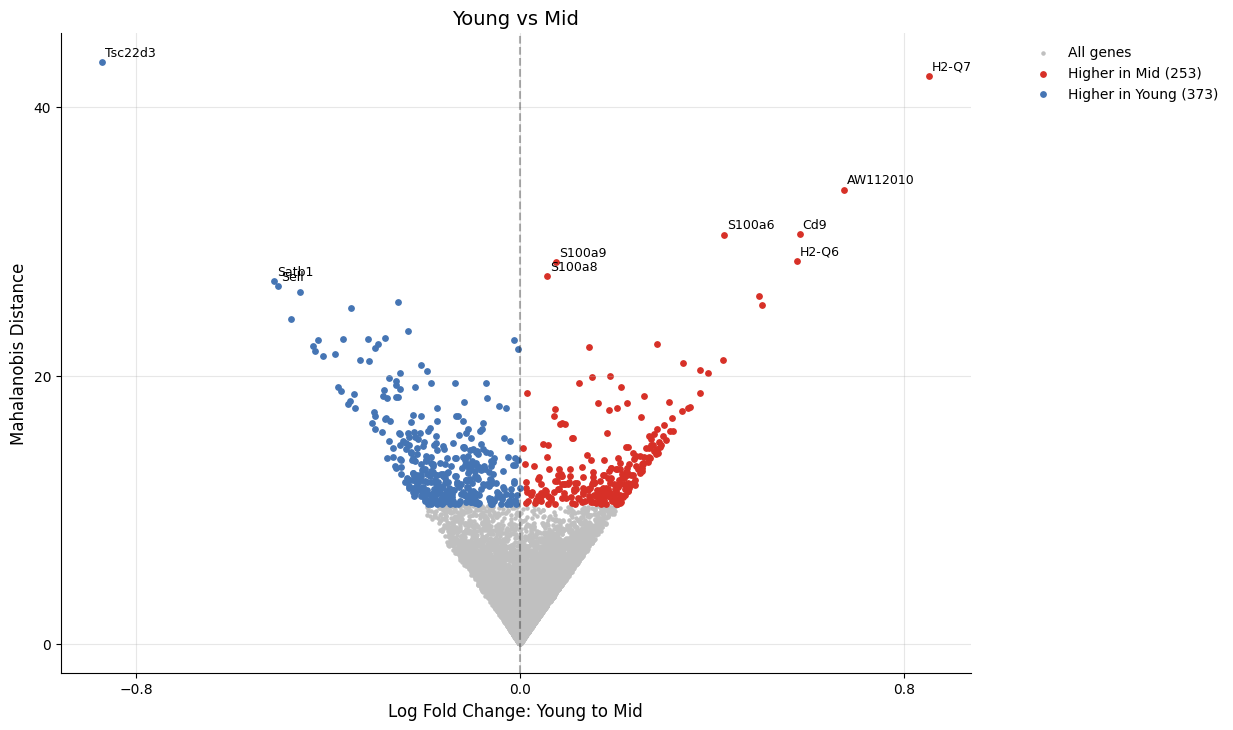
[15]:
# Plot the second comparison (Young vs Mid)
kompot.plot.volcano_de(adata, run_id=1, title="Young vs Mid")
[2026-03-26 05:39:39,915] [INFO    ] Found DE run info for run_id=1
[2026-03-26 05:39:39,917] [INFO    ] Found mean_lfc_key='kompot_de_Young_to_Mid_mean_lfc' from run info
[2026-03-26 05:39:39,918] [INFO    ] Found mahalanobis_key='kompot_de_Young_to_Mid_mahalanobis' from run info
[2026-03-26 05:39:39,919] [INFO    ] Successfully inferred fields: {'mean_lfc_key': 'kompot_de_Young_to_Mid_mean_lfc', 'mahalanobis_key': 'kompot_de_Young_to_Mid_mahalanobis'}
[2026-03-26 05:39:39,920] [INFO    ] Using DE run 1: comparing Young to Mid
[2026-03-26 05:39:39,930] [INFO    ] Using data columns from var - lfc: 'kompot_de_Young_to_Mid_mean_lfc', score: 'kompot_de_Young_to_Mid_mahalanobis'
[2026-03-26 05:39:39,935] [INFO    ] Highlighting 626 genes marked as DE (253 up, 373 down)
[2026-03-26 05:39:39,948] [INFO    ] Labeling top 10 genes by score
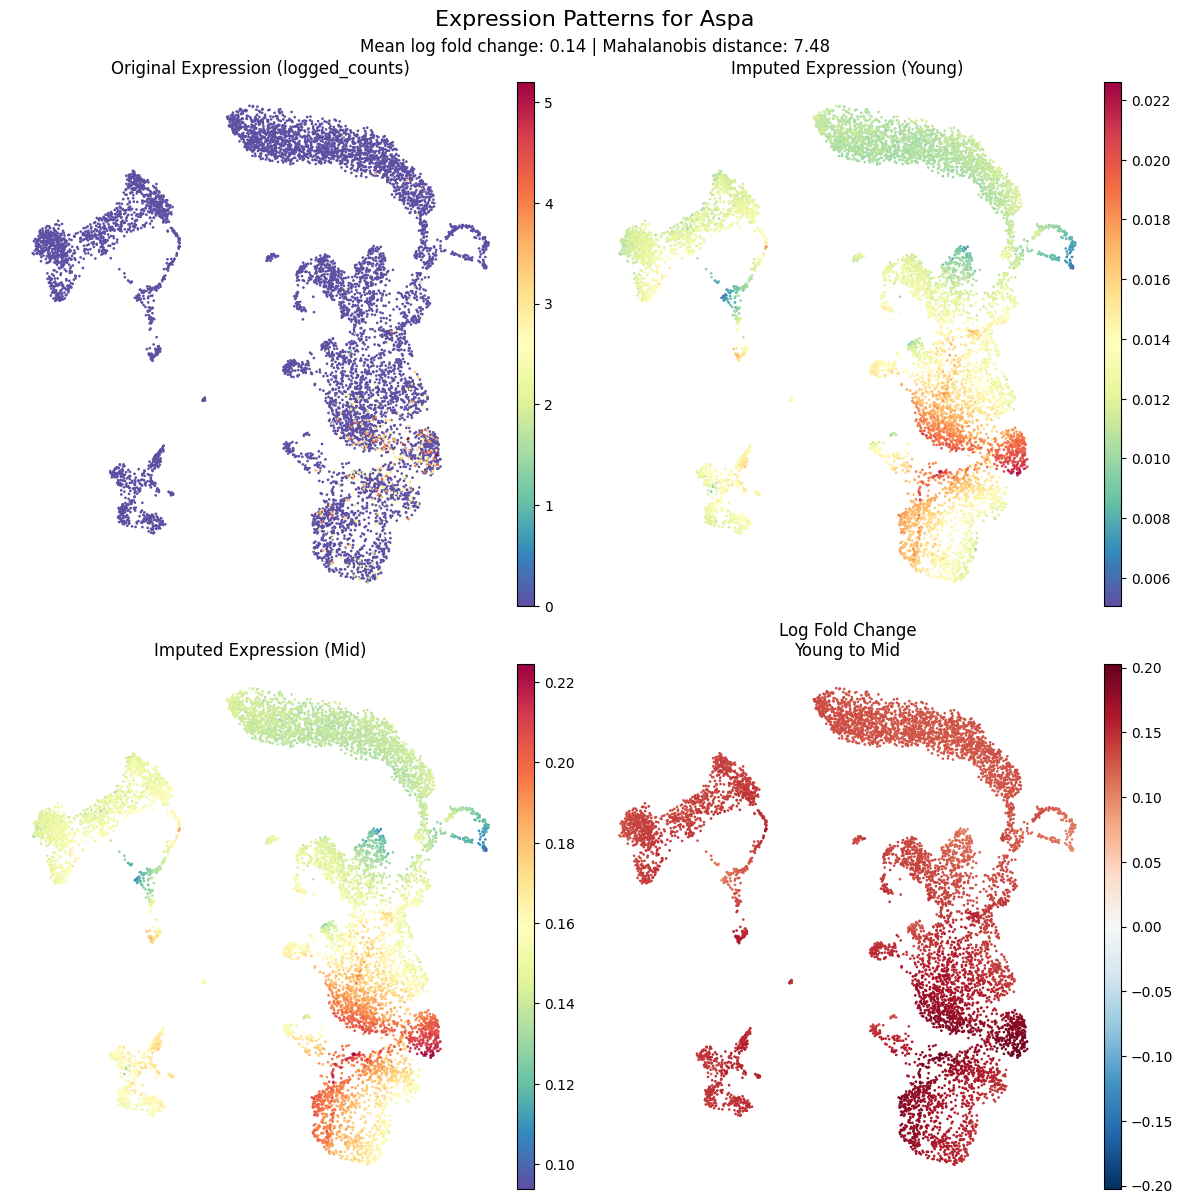
[16]:
kompot.plot.plot_gene_expression(
    adata, gene="Aspa", frameon=False
)
[2026-03-26 05:39:40,191] [INFO    ] Found DE run info for run_id=-1
[2026-03-26 05:39:40,193] [INFO    ] Found mean_lfc_key='kompot_de_Young_to_Mid_mean_lfc' from run info
[2026-03-26 05:39:40,194] [INFO    ] Found mahalanobis_key='kompot_de_Young_to_Mid_mahalanobis' from run info
[2026-03-26 05:39:40,196] [INFO    ] Successfully inferred fields: {'mean_lfc_key': 'kompot_de_Young_to_Mid_mean_lfc', 'mahalanobis_key': 'kompot_de_Young_to_Mid_mahalanobis'}
[2026-03-26 05:39:40,197] [INFO    ] Using DE run 1: comparing Young to Mid
[2026-03-26 05:39:40,198] [INFO    ] Using fields for gene expression plot - lfc_key: 'kompot_de_Young_to_Mid_mean_lfc', score_key: 'kompot_de_Young_to_Mid_mahalanobis'
[2026-03-26 05:39:40,198] [INFO    ] Using layer 'logged_counts' inferred from run information
[2026-03-26 05:39:40,200] [INFO    ] Using imputed layer 'kompot_de_Young_imputed' for 'Young'
[2026-03-26 05:39:40,201] [INFO    ] Using imputed layer 'kompot_de_Mid_imputed' for 'Mid'
[2026-03-26 05:39:40,201] [INFO    ] Using fold_change layer 'kompot_de_Young_to_Mid_fold_change' from run_info
You can also use negative indexing (run_id=-1 for the most recent run).
Inspecting Run Metadata
The RunInfo utility provides detailed information about each analysis. Here we inspect the first run to see that some data has been overwritten by the most recent one:
[17]:
run_info = kompot.RunInfo(adata, run_id=0, analysis_type="de")
run_info
[17]:
Run 0 (DE Analysis)
Run Summary
| Parameter | Value |
|---|---|
| conditions | Young to Old |
| obsm_key | X_pca_harmony |
| uses_sample_variance | False |
| layer | logged_counts |
| timestamp | 2026-03-27T00:41:42.174094 |
| Fields Created | 9 |
All Parameters
| Parameter | Value |
|---|---|
| groupby | Age |
| condition1 | Young |
| condition2 | Old |
| obsm_key | X_pca_harmony |
| layer | logged_counts |
| gp | |
| gp.sigma | 1.0 |
| gp.ls_factor | 10.0 |
| gp.n_landmarks | 5000 |
| gp.use_empirical_variance | False |
| gp.batch_size | 0 |
| gp.eps | 1e-08 |
| gp.jit_compile | False |
| fdr | |
| fdr.null_genes | 4000 |
| fdr.null_seed | 42 |
| fdr.threshold | 0.05 |
| filter | |
| filter.min_cells | 2 |
| storage | |
| storage.result_key | kompot_de |
| storage.store_landmarks | False |
| storage.store_posterior_covariance | False |
| storage.store_additional_stats | False |
| storage.max_memory_ratio | 0.8 |
| output | |
| output.copy | False |
| output.inplace | True |
| output.return_full_results | False |
| output.compute_mahalanobis | True |
| output.allow_single_condition_variance | False |
| output.progress | True |
| result_key | kompot_de |
Environment
| Parameter | Value |
|---|---|
| hostname | gizmok39 |
| package_versions | anndata: 0.12.10 jax: 0.9.0.1 jaxlib: 0.9.0.1 kompot: 0.7.0 numpy: 2.4.2 pandas: 2.3.3 scipy: 1.17.1 |
| pid | 18304 |
| platform | Linux-4.15.0-213-generic-x86_64-with-glibc2.35 |
| python_version | 3.12.12 |
| timestamp | 2026-03-27T00:41:42.716684 |
| username | dotto |
Fields Created by This Run
| Field Name | Location | Description | Status |
|---|---|---|---|
| LAYERS Fields | |||
| kompot_de_Old_imputed | layers | [imputed] Imputed expression for Old | Present |
| kompot_de_Young_imputed | layers | [imputed] Imputed expression for Young | Overwritten by Run 1 |
| kompot_de_Young_to_Old_fold_change | layers | [fold_change] Log fold change for each cell and gene | Present |
| OBS Fields | |||
| kompot_de_Old_std | obs | [std] Posterior standard deviation of imputed expression for Old (same for all genes) | Present |
| kompot_de_Young_std | obs | [std] Posterior standard deviation of imputed expression for Young (same for all genes) | Overwritten by Run 1 |
| VAR Fields | |||
| kompot_de_Young_to_Old_is_de | var | [is_de] Boolean indicator of differential expression at local FDR < 0.05 | Present |
| kompot_de_Young_to_Old_mahalanobis | var | [mahalanobis] Mahalanobis distances | Present |
| kompot_de_Young_to_Old_mahalanobis_local_fdr | var | [mahalanobis_local_fdr] Local FDR values using empirical null estimation similar to R's fdrtool | Present |
| kompot_de_Young_to_Old_mean_lfc | var | [mean_log_fold_change] Mean log fold change values | Present |
Comparing Runs
Compare parameters between two runs:
[18]:
kompot.RunInfo(adata, run_id=0, analysis_type="de").compare_with(1)
[18]:
Comparison of Run 0 and Run 1
Summary
| Aspect | Run Details | |
|---|---|---|
| Run 0 | Run 1 | |
| conditions | Young to Old | Young to Mid |
| result_key | kompot_de | kompot_de |
| uses_sample_variance | False | False |
| timestamp | 2026-03-27T00:41:42.174094 | 2026-03-27T00:42:58.693517 |
| Field Count | 9 | 9 |
Parameter Differences
Key Parameter Differences
| Parameter | Run 0 | Run 1 |
|---|---|---|
| condition2 | Old | Mid |
All Parameter Differences
| Parameter | Run 0 | Run 1 |
|---|---|---|
| Different Parameters | ||
| fdr.null_genes | 4000 | 2000 |
| 38 parameters are the same in both runs | ||
Field Differences
| Field Name | Location | Status | Last Modified By |
|---|---|---|---|
| LAYERS Shared Fields | |||
| kompot_de_Young_imputed | layers | Current value from Run 1 | Run 1 |
| OBS Shared Fields | |||
| kompot_de_Young_std | obs | Current value from Run 1 | Run 1 |
| LAYERS Different Fields | |||
| kompot_de_Old_imputed | layers | Only in Run 0 | Run 0 |
| kompot_de_Young_to_Old_fold_change | layers | Only in Run 0 | Run 0 |
| kompot_de_Mid_imputed | layers | Only in Run 1 | Run 1 |
| kompot_de_Young_to_Mid_fold_change | layers | Only in Run 1 | Run 1 |
| OBS Different Fields | |||
| kompot_de_Old_std | obs | Only in Run 0 | Run 0 |
| kompot_de_Mid_std | obs | Only in Run 1 | Run 1 |
| VAR Different Fields | |||
| kompot_de_Young_to_Old_is_de | var | Only in Run 0 | Run 0 |
| kompot_de_Young_to_Old_mahalanobis | var | Only in Run 0 | Run 0 |
| kompot_de_Young_to_Old_mahalanobis_local_fdr | var | Only in Run 0 | Run 0 |
| kompot_de_Young_to_Old_mean_lfc | var | Only in Run 0 | Run 0 |
| kompot_de_Young_to_Mid_is_de | var | Only in Run 1 | Run 1 |
| kompot_de_Young_to_Mid_mahalanobis | var | Only in Run 1 | Run 1 |
| kompot_de_Young_to_Mid_mahalanobis_local_fdr | var | Only in Run 1 | Run 1 |
| kompot_de_Young_to_Mid_mean_lfc | var | Only in Run 1 | Run 1 |
Reproducing and Editing Runs
Every run stores its parameters as Settings objects. Use call_args() to get a kwargs dict that can reproduce the run, or edit it first:
[19]:
kwargs = run_info.call_args()

# Tweak parameters before re-running
kwargs["fdr"].threshold = 0.01          # tighten FDR
kwargs["condition2"] = "Mid"            # different comparison
kwargs["gp"].n_landmarks = 3000         # fewer landmarks

# kompot.de(adata, **kwargs) # reproduce de run with similar parameters
Resource Planning
For large datasets, pass dry_run=True to estimate resource requirements before running the full analysis:
[19]:
plan = kompot.de(
    adata,
    groupby=GROUPING_COLUMN,
    condition1="Young",
    condition2="Old",
    layer=LAYER_FOR_EXPRESSION,
    obsm_key=DIMENSIONALITY_REDUCTION,
    fdr=kompot.FDRSettings(null_genes=2000),
    dry_run=True,
)
================================================================================
RESOURCE USAGE PLAN
================================================================================

System Resources:
  Memory: 316.82 GB available (of 754.59 GB total)
  Disk:   377.28 GB available at /tmp

Total Requirements:
  Memory: 31.76 GB (10% of available)

Memory Allocations:
  • Mellon precision matrix L (condition 1, 2,917/3,116 cells) (np.int64(2917), np.int64(2917)): 64.92 MB
  • Mellon precision matrix L (condition 2, 2,917/3,116 cells) (np.int64(3116), np.int64(3116)): 74.08 MB
  • Imputed expression (condition 1) (8090, 18285): 1.10 GB → adata.layers['kompot_de_Young_imputed']
  • Imputed expression (condition 2) (8090, 18285): 1.10 GB → adata.layers['kompot_de_Old_imputed']
  • Fold change (8090, 18285): 1.10 GB → adata.layers['kompot_de_Young_to_Old_fold_change']
  • Temporary matrices during predictions (batch_size=100) (100, 5000) + (100, 18285): 17.77 MB
  • Peak intermediate arrays during predictions (~25 arrays) 25×(8090, 18285): 27.55 GB
  • Function predictor covariances (per condition) (5000, 5000): 381.47 MB
  • Combined covariance matrix (5000, 5000): 190.73 MB
  • Cholesky decomposition (for Mahalanobis) (5000, 5000): 190.73 MB
  • Mahalanobis batch processing (batch_size=100) (100, 5000): 3.81 MB

Output Fields:
  adata.layers:
    - kompot_de_Young_imputed [OVERWRITES run_id=1]
    - kompot_de_Old_imputed [OVERWRITES run_id=0]
    - kompot_de_Young_to_Old_fold_change [OVERWRITES run_id=0]
  adata.var:
    - kompot_de_Young_to_Old_mahalanobis [OVERWRITES run_id=0]
    - kompot_de_Young_to_Old_mean_lfc [OVERWRITES run_id=0]
    - kompot_de_Young_to_Old_mahalanobis_local_fdr
    - kompot_de_Young_to_Old_is_de

Info:
  ℹ Null distribution will use 2000 additional genes (total: 18285 genes processed)
  ℹ Cell batching reduces memory: Each of 4 prediction operations uses ~17.77 MB temporary arrays instead of 1.40 GB (saving 1.39 GB).
  ℹ Prediction creates ~25 intermediate arrays of shape (8,090, 18285). These coexist at peak memory (27.55 GB) but are freed before completion.
  ℹ Mahalanobis computation processes 100 genes per batch. Reduce via gp=GPSettings(batch_size=...) to lower peak memory (currently 3.81 MB for batch arrays).

Warnings:
  ⚠ Results with result_key='kompot_de' already exist (run_id=1). Previous run: 2026-03-26T05:39:38.441389 comparing Young to Mid (null_genes=2000). Fields that will be overwritten: var.kompot_de_Young_to_Old_mahalanobis, var.kompot_de_Young_to_Old_mean_lfc, layers.kompot_de_Young_imputed, layers.kompot_de_Old_imputed, layers.kompot_de_Young_to_Old_fold_change and 2 more

================================================================================
STATUS: ⚠ FEASIBLE WITH WARNINGS - Proceed with caution
================================================================================
The report shows:
Available system memory and disk space
Estimated memory requirements for each computation step
Which fields will be created or overwritten (with
run_id)Whether the analysis is feasible
This is especially useful for testing different parameter combinations (e.g., with/without sample variance) before committing to a long computation.
Saving Results
Selective Cleanup
Remove imputed expression layers while preserving statistical results:
# This keeps adata.var statistics but removes large adata.layers kompot.cleanup(adata)To clean up specific runs only:
# Clean up only the first run kompot.cleanup(adata, run_ids=0, analysis_type="de")adata.write_h5ad("../data/murine_bone_marrow_aging_processed.h5ad")Summary
This tutorial covered:
null_genes, sigma, batch_size)run_idNext Steps
Tutorial 3: Sample Variance Analysis - Account for biological replicates
API Documentation: kompot.readthedocs.io