Differential Expression: Advanced Options
Building on Getting Started, this notebook covers the knobs you reach for on real projects:
tuning DE parameters,
running and tracking multiple comparisons,
reproducing a past run,
planning memory and disk before a long job,
advanced FDR and volcano options.
The statistical background is in the paper.
[1]:
%matplotlib inline

import anndata as ad
import matplotlib.pyplot as plt
import numpy as np
import palantir
import pandas as pd
import scanpy as sc

import kompot

# Consistent, clean plotting style across the tutorial set
plt.rcParams["axes.spines.right"] = False
plt.rcParams["axes.spines.top"] = False
plt.rcParams["image.cmap"] = "Spectral_r"
/fh/fast/setty_m/user/dotto/nexus/work/kompot-080/.venv-312/lib/python3.12/site-packages/tqdm/auto.py:21: TqdmWarning: IProgress not found. Please update jupyter and ipywidgets. See https://ipywidgets.readthedocs.io/en/stable/user_install.html
  from .autonotebook import tqdm as notebook_tqdm
[2]:
DATA_PATH = "../data/murine_bone_marrow_aging.h5ad"
GROUPING_COLUMN = "Age"
CONDITIONS = ["Young", "Old"]
CELL_TYPE_COLUMN = "highres_celltype"
DIMENSIONALITY_REDUCTION = "DM_EigenVectors"
LAYER_FOR_EXPRESSION = "logged_counts"
Load Data
Same dataset as the first tutorial:
[3]:
adata = ad.read_h5ad(DATA_PATH)
palantir.utils.run_diffusion_maps(adata, pca_key="X_pca_harmony", n_components=40)
adata
/fh/fast/setty_m/user/dotto/nexus/work/kompot-080/.venv-312/lib/python3.12/site-packages/joblib/externals/loky/backend/context.py:131: UserWarning: Could not find the number of physical cores for the following reason:
found 0 physical cores < 1
Returning the number of logical cores instead. You can silence this warning by setting LOKY_MAX_CPU_COUNT to the number of cores you want to use.
  warnings.warn(
  File "/fh/fast/setty_m/user/dotto/nexus/work/kompot-080/.venv-312/lib/python3.12/site-packages/joblib/externals/loky/backend/context.py", line 255, in _count_physical_cores
    raise ValueError(f"found {cpu_count_physical} physical cores < 1")
[3]:
AnnData object with n_obs × n_vars = 8090 × 16285
    obs: 'Compartment', 'Replicate', 'Age', 'Sample', 'Info', 'batch', 'doublet_score', 'n_genes_by_counts', 'total_counts', 'total_counts_mt', 'pct_counts_mt', 'total_counts_hb', 'pct_counts_hb', 'S_score', 'G2M_score', 'phase', 'leiden', 'phenograph', 'highres_celltype', 'midres_celltype'
    var: 'gene_ids', 'feature_types', 'genome', 'mt', 'n_cells_by_counts', 'mean_counts', 'pct_dropout_by_counts', 'total_counts', 'hb', 'highly_variable', 'means', 'dispersions', 'dispersions_norm', 'highly_variable_nbatches', 'highly_variable_intersection'
    uns: 'Age_colors', 'Compartment_colors', 'DMEigenValues', 'DM_EigenValues', 'Info_colors', 'README', 'Replicate_colors', 'Sample_colors', 'batch_colors', 'draw_graph', 'highres_celltype_colors', 'hvg', 'leiden', 'leiden_colors', 'midres_celltype_colors', 'neighbors', 'pca', 'phase_colors', 'umap'
    obsm: 'AbCapture', 'DM_EigenVectors', 'HTO', 'X_draw_graph_fa', 'X_pca', 'X_pca_harmony', 'X_pca_noregression', 'X_umap'
    varm: 'PCs'
    obsp: 'DM_Kernel', 'DM_Similarity', 'connectivities', 'distances'
    layers: 'MAGIC_imputed_data', 'cc_counts', 'logged_counts', 'normalized_counts', 'raw_counts', None (.X)
Tuning DE Parameters
Advanced options are grouped into Settings dataclasses; any field left at its default is the same as omitting it.
GPSettings— GP model:sigma(noise level),ls_factor(smoothness of the expression function — see Controlling smoothness below),n_landmarks(accuracy vs. speed, and the quadratic driver of sample-variance memory),batch_size(peak memory;0= all cells at once).FDRSettings—null_genes(permuted genes for FDR; more = better estimate, slower),threshold(the FDR used foris_de).StorageSettings—result_key(field-name prefix; change it to keep several runs side by side),store_arrays_on_disk(keeps the sample-variance covariance tensors out of memory).
One argument is not a Settings field and is in a cost class of its own: sample_col. It enables sample variance, which gives every gene its own (n_landmarks, n_landmarks) covariance matrix per condition — about 0.37 GiB per gene at the default 5 000 landmarks — and one Cholesky factorisation per gene. It belongs in a second pass over a restricted gene list, never in a whole-transcriptome run. See DE with sample variance and Planning Memory and
Disk.
[4]:
de_results = kompot.de(
    adata,
    groupby=GROUPING_COLUMN,
    condition1=CONDITIONS[0],
    condition2=CONDITIONS[1],
    layer=LAYER_FOR_EXPRESSION,
    obsm_key=DIMENSIONALITY_REDUCTION,
    gp=kompot.GPSettings(batch_size=0),
    fdr=kompot.FDRSettings(null_genes=4000),   # more null genes = tighter FDR
)
[2026-07-28 13:48:29,271] [INFO    ] Condition 1 (Young): 2,917 cells
[2026-07-28 13:48:29,272] [INFO    ] Condition 2 (Old): 3,116 cells
[2026-07-28 13:48:35,238] [INFO    ] Fitting expression estimator for condition 1...
[2026-07-28 13:49:07,429] [INFO    ] Fitting expression estimator for condition 2...
[2026-07-28 13:50:39,660] [INFO    ] FDR analysis complete: 50/16285 genes significantly DE at FDR < 0.05
[2026-07-28 13:50:39,661] [INFO    ] Mahalanobis distance threshold for FDR < 0.05: 7.4159
[2026-07-28 13:50:46,281] [INFO    ] This run will have `run_id=0`.
Advanced Volcano Options
The y-axis defaults to Mahalanobis distance. Switch it to local FDR, and set per-metric significance thresholds:
[5]:
kompot.plot.volcano_de(
    adata,
    y_axis_type="local_fdr",
    significance_threshold=0.02,
)
[2026-07-28 13:50:46,928] [INFO    ] Found DE run info for run_id=-1
[2026-07-28 13:50:46,931] [INFO    ] Found mean_lfc_key='kompot_de_Young_to_Old_mean_lfc' from run info
[2026-07-28 13:50:46,932] [INFO    ] Found mahalanobis_key='kompot_de_Young_to_Old_mahalanobis' from run info
[2026-07-28 13:50:46,934] [INFO    ] Successfully inferred fields: {'mean_lfc_key': 'kompot_de_Young_to_Old_mean_lfc', 'mahalanobis_key': 'kompot_de_Young_to_Old_mahalanobis'}
[2026-07-28 13:50:46,934] [INFO    ] Using local_fdr values for y-axis: kompot_de_Young_to_Old_mahalanobis_local_fdr
[2026-07-28 13:50:46,935] [INFO    ] Using DE run 0: comparing Young to Old
[2026-07-28 13:50:46,947] [INFO    ] Using data columns from var - lfc: 'kompot_de_Young_to_Old_mean_lfc', score: 'kompot_de_Young_to_Old_mahalanobis_local_fdr'
[2026-07-28 13:50:46,949] [INFO    ] Applied local_fdr transformation to y-axis data
[2026-07-28 13:50:46,950] [INFO    ] Significance threshold selection: using column 'kompot_de_Young_to_Old_mahalanobis_local_fdr' with threshold < 0.02
[2026-07-28 13:50:46,951] [INFO    ] Values range: 0.000000 - 1.000000
[2026-07-28 13:50:46,955] [INFO    ] Found 44 genes with local_fdr < 0.02
[2026-07-28 13:50:46,959] [INFO    ] Highlighting 44 genes at local_fdr < 0.02 (26 up, 18 down)
[2026-07-28 13:50:46,973] [INFO    ] Labeling top 10 genes by score
[2026-07-28 13:50:46,979] [INFO    ] Added local_fdr threshold line at y=1.70 (local_fdr=0.02)

significance_threshold accepts a dict to combine criteria, and gene_labels can be a list, a {gene: label} dict, or an integer to auto-label the top N genes.
Note how the Mahalanobis cut is chosen from the data rather than written as a literal. Mahalanobis distances are not on an absolute scale — they depend on the posterior covariance, so they shift with the dataset and with the Kompot version (0.8.0 divides them by √2). A hard-coded number that selects a sensible set on one dataset can select nothing on another. When no gene meets every criterion, volcano_de highlights nothing and warns — an empty highlight is a real negative result, not a
failed plot.
The per-criterion counts in the log are worth reading: each threshold reports how many genes it passes on its own, then how many pass all of them together. If a criterion passes nearly everything, it is not contributing to the selection.
One caveat specific to this pair: local_fdr is derived from mahalanobis, so the two are nested by construction — whichever is stricter subsumes the other, and the conjunction can never be smaller than that. Combining them tightens the selection (44 genes to 33 here) but it is not two independent lines of evidence. Pairing a significance criterion with an independent quantity, such as a fold-change magnitude or a var column of your own, is where the dict form earns its keep.
[6]:
# Take the secondary cut from the observed distribution so the example stays
# meaningful on any dataset, instead of hard-coding a scale-dependent literal.
# A high quantile is what makes the AND do work here: the FDR-significant genes
# already sit far out in the Mahalanobis tail, so a permissive cut would pass all
# of them and the second criterion would be inert.
mahalanobis = adata.var["kompot_de_Young_to_Old_mahalanobis"]
mahalanobis_cut = float(mahalanobis.quantile(0.998))

kompot.plot.volcano_de(
    adata,
    significance_threshold={"local_fdr": 0.02, "mahalanobis": mahalanobis_cut},
    gene_labels=25,
)
[2026-07-28 13:50:47,422] [INFO    ] Found DE run info for run_id=-1
[2026-07-28 13:50:47,423] [INFO    ] Found mean_lfc_key='kompot_de_Young_to_Old_mean_lfc' from run info
[2026-07-28 13:50:47,423] [INFO    ] Found mahalanobis_key='kompot_de_Young_to_Old_mahalanobis' from run info
[2026-07-28 13:50:47,424] [INFO    ] Successfully inferred fields: {'mean_lfc_key': 'kompot_de_Young_to_Old_mean_lfc', 'mahalanobis_key': 'kompot_de_Young_to_Old_mahalanobis'}
[2026-07-28 13:50:47,425] [INFO    ] Using DE run 0: comparing Young to Old
[2026-07-28 13:50:47,433] [INFO    ] Using data columns from var - lfc: 'kompot_de_Young_to_Old_mean_lfc', score: 'kompot_de_Young_to_Old_mahalanobis'
[2026-07-28 13:50:47,435] [INFO    ] Applied threshold: local_fdr < 0.02 (44 genes pass)
[2026-07-28 13:50:47,436] [INFO    ] Applied threshold: mahalanobis > 8.038593996180095 (33 genes pass)
[2026-07-28 13:50:47,437] [INFO    ] Found 33 genes passing all thresholds: local_fdr < 0.02 AND mahalanobis > 8.038593996180095
[2026-07-28 13:50:47,440] [INFO    ] Highlighting 33 genes with multiple thresholds (20 up, 13 down)
[2026-07-28 13:50:47,452] [INFO    ] Labeling top 25 genes by score
[2026-07-28 13:50:47,459] [INFO    ] Skipping threshold line drawing for dictionary-format significance_threshold

Multiple Comparisons
Kompot tracks every run. Add a second comparison (Young vs. Mid) on the same object; Kompot warns before overwriting and records which run wrote each field:
[7]:
de_young_mid = kompot.de(
    adata,
    groupby=GROUPING_COLUMN,
    condition1="Young",
    condition2="Mid",
    layer=LAYER_FOR_EXPRESSION,
    obsm_key=DIMENSIONALITY_REDUCTION,
    gp=kompot.GPSettings(batch_size=0),
)
[2026-07-28 13:50:47,948] [WARNING ] Differential expression results with result_key='kompot_de' already exist in the dataset. Previous run was at 2026-07-28T13:50:46.259208 comparing Young to Old. Fields that will be overwritten: layers.kompot_de_Young_smoothed, obs.kompot_de_Young_std Set overwrite=False to prevent overwriting or overwrite=True to silence this message.
[2026-07-28 13:50:47,949] [INFO    ] Condition 1 (Young): 2,917 cells
[2026-07-28 13:50:47,949] [INFO    ] Condition 2 (Mid): 2,057 cells
[2026-07-28 13:50:50,133] [INFO    ] Fitting expression estimator for condition 1...
[2026-07-28 13:51:07,758] [INFO    ] Fitting expression estimator for condition 2...
[2026-07-28 13:52:38,532] [INFO    ] FDR analysis complete: 26/16285 genes significantly DE at FDR < 0.05
[2026-07-28 13:52:38,534] [INFO    ] Mahalanobis distance threshold for FDR < 0.05: 7.2080
[2026-07-28 13:52:44,934] [INFO    ] This run will have `run_id=1`.
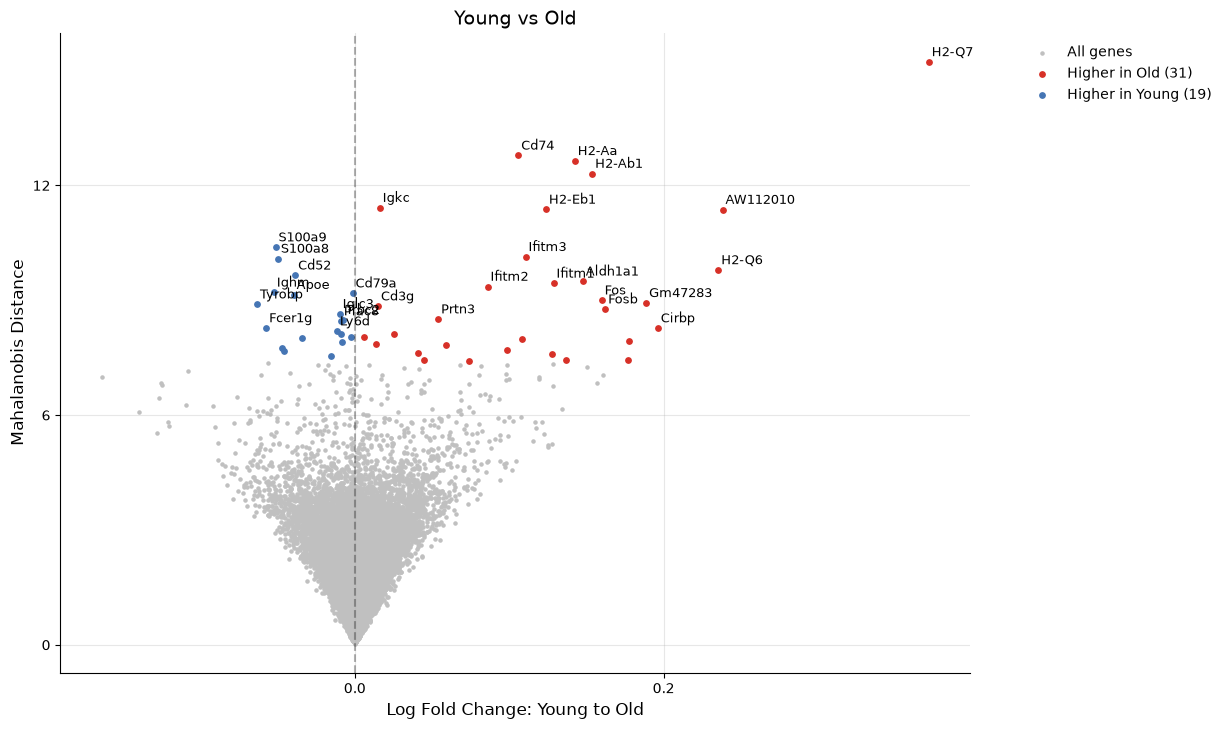
Each run gets a run_id (0 first, 1 next, -1 = most recent). Most plotting functions accept it:
[8]:
kompot.plot.volcano_de(adata, run_id=0, title="Young vs Old", gene_labels=30)
[2026-07-28 13:52:45,472] [INFO    ] Found DE run info for run_id=0
[2026-07-28 13:52:45,473] [INFO    ] Found mean_lfc_key='kompot_de_Young_to_Old_mean_lfc' from run info
[2026-07-28 13:52:45,474] [INFO    ] Found mahalanobis_key='kompot_de_Young_to_Old_mahalanobis' from run info
[2026-07-28 13:52:45,475] [WARNING ] Field 'kompot_de_Young_to_Old_mean_lfc' was last written by run 0, but current context expects run 1. The field may have been overwritten.
[2026-07-28 13:52:45,476] [WARNING ] Field 'kompot_de_Young_to_Old_mahalanobis' was last written by run 0, but current context expects run 1. The field may have been overwritten.
[2026-07-28 13:52:45,477] [INFO    ] Successfully inferred fields: {'mean_lfc_key': 'kompot_de_Young_to_Old_mean_lfc', 'mahalanobis_key': 'kompot_de_Young_to_Old_mahalanobis'}
[2026-07-28 13:52:45,477] [WARNING ] Field inference completed with 2 warnings
[2026-07-28 13:52:45,478] [INFO    ] Using DE run 0: comparing Young to Old
[2026-07-28 13:52:45,486] [INFO    ] Using data columns from var - lfc: 'kompot_de_Young_to_Old_mean_lfc', score: 'kompot_de_Young_to_Old_mahalanobis'
[2026-07-28 13:52:45,490] [INFO    ] Highlighting 50 genes marked as DE (31 up, 19 down)
[2026-07-28 13:52:45,503] [INFO    ] Labeling top 30 genes by score
[9]:
kompot.plot.volcano_de(adata, run_id=1, title="Young vs Mid", gene_labels=30)
[2026-07-28 13:52:46,026] [INFO    ] Found DE run info for run_id=1
[2026-07-28 13:52:46,027] [INFO    ] Found mean_lfc_key='kompot_de_Young_to_Mid_mean_lfc' from run info
[2026-07-28 13:52:46,027] [INFO    ] Found mahalanobis_key='kompot_de_Young_to_Mid_mahalanobis' from run info
[2026-07-28 13:52:46,029] [INFO    ] Successfully inferred fields: {'mean_lfc_key': 'kompot_de_Young_to_Mid_mean_lfc', 'mahalanobis_key': 'kompot_de_Young_to_Mid_mahalanobis'}
[2026-07-28 13:52:46,030] [INFO    ] Using DE run 1: comparing Young to Mid
[2026-07-28 13:52:46,036] [INFO    ] Using data columns from var - lfc: 'kompot_de_Young_to_Mid_mean_lfc', score: 'kompot_de_Young_to_Mid_mahalanobis'
[2026-07-28 13:52:46,040] [INFO    ] Highlighting 26 genes marked as DE (14 up, 12 down)
[2026-07-28 13:52:46,056] [INFO    ] Labeling top 30 genes by score

Run Tracking & Reproducibility
Compare the parameters of two runs:
[10]:
kompot.RunInfo(adata, run_id=0, analysis_type="de").compare_with(1)
[10]:
Comparison of Run 0 and Run 1
Summary
| Aspect | Run Details | |
|---|---|---|
| Run 0 | Run 1 | |
| conditions | Young to Old | Young to Mid |
| result_key | kompot_de | kompot_de |
| uses_sample_variance | False | False |
| timestamp | 2026-07-28T13:50:46.259208 | 2026-07-28T13:52:44.889145 |
| Field Count | 9 | 9 |
Parameter Differences
Key Parameter Differences
| Parameter | Run 0 | Run 1 |
|---|---|---|
| condition2 | Old | Mid |
All Parameter Differences
| Parameter | Run 0 | Run 1 |
|---|---|---|
| Different Parameters | ||
| fdr.null_genes | 4000 | 2000 |
| 42 parameters are the same in both runs | ||
Field Differences
| Field Name | Location | Status | Last Modified By |
|---|---|---|---|
| LAYERS Shared Fields | |||
| kompot_de_Young_smoothed | layers | Current value from Run 1 | Run 1 |
| OBS Shared Fields | |||
| kompot_de_Young_std | obs | Current value from Run 1 | Run 1 |
| LAYERS Different Fields | |||
| kompot_de_Old_smoothed | layers | Only in Run 0 | Run 0 |
| kompot_de_Young_to_Old_fold_change | layers | Only in Run 0 | Run 0 |
| kompot_de_Mid_smoothed | layers | Only in Run 1 | Run 1 |
| kompot_de_Young_to_Mid_fold_change | layers | Only in Run 1 | Run 1 |
| OBS Different Fields | |||
| kompot_de_Old_std | obs | Only in Run 0 | Run 0 |
| kompot_de_Mid_std | obs | Only in Run 1 | Run 1 |
| VAR Different Fields | |||
| kompot_de_Young_to_Old_is_de | var | Only in Run 0 | Run 0 |
| kompot_de_Young_to_Old_mahalanobis | var | Only in Run 0 | Run 0 |
| kompot_de_Young_to_Old_mahalanobis_local_fdr | var | Only in Run 0 | Run 0 |
| kompot_de_Young_to_Old_mean_lfc | var | Only in Run 0 | Run 0 |
| kompot_de_Young_to_Mid_is_de | var | Only in Run 1 | Run 1 |
| kompot_de_Young_to_Mid_mahalanobis | var | Only in Run 1 | Run 1 |
| kompot_de_Young_to_Mid_mahalanobis_local_fdr | var | Only in Run 1 | Run 1 |
| kompot_de_Young_to_Mid_mean_lfc | var | Only in Run 1 | Run 1 |
call_args() returns a kwargs dict that reproduces a run — edit it, then pass it straight back to kompot.de:
[11]:
run_info = kompot.RunInfo(adata, run_id=0, analysis_type="de")
kwargs = run_info.call_args()

kwargs["fdr"].threshold = 0.01     # tighten FDR
kwargs["gp"].n_landmarks = 3000    # fewer landmarks

# kompot.de(adata, **kwargs)       # re-run with the tweaked parameters
kwargs.keys()
[11]:
dict_keys(['groupby', 'condition1', 'condition2', 'obsm_key', 'sample_col', 'layer', 'genes', 'gp', 'fdr', 'filter', 'storage', 'output'])
Controlling smoothness: ls_factor
ls_factor (a GPSettings field, default 10) scales the length scale of the Gaussian process that fits each condition’s expression function: the automatically inferred length scale is multiplied by ls_factor. A larger value stretches that scale, so the fit pools information across a wider neighborhood of cells — the expression surface gets smoother and its posterior uncertainty shrinks, but fine, localized structure is averaged away (coarser resolution). A smaller
value does the reverse: a sharper, higher-resolution surface that follows local variation, at the price of noisier, less certain estimates. This is the usual resolution-vs-uncertainty trade-off; the paper covers the theory.
Below is the same Young→Old fit for the top gene at a low vs. high ls_factor, on that one gene with FDR turned off (illustration only). kompot.de stores each condition’s smoothed expression as an adata.layers entry and the GP’s posterior uncertainty as an adata.obs column, so we can project both onto the UMAP:
[12]:
c1, c2 = CONDITIONS
gene = adata.var[f"kompot_de_{c1}_to_{c2}_mahalanobis"].idxmax()   # top gene from above

for ls_factor, key in [(2.0, "kompot_ls_low"), (30.0, "kompot_ls_high")]:
    kompot.de(
        adata,
        groupby=GROUPING_COLUMN, condition1=c1, condition2=c2,
        layer=LAYER_FOR_EXPRESSION, obsm_key=DIMENSIONALITY_REDUCTION,
        genes=[gene],                                   # one gene keeps it fast
        gp=kompot.GPSettings(ls_factor=ls_factor, batch_size=0),
        fdr=kompot.FDRSettings(null_genes=0),           # no FDR needed for illustration
        storage=kompot.StorageSettings(result_key=key),
    )
[2026-07-28 13:52:46,614] [INFO    ] Condition 1 (Young): 2,917 cells
[2026-07-28 13:52:46,615] [INFO    ] Condition 2 (Old): 3,116 cells
[2026-07-28 13:52:50,232] [INFO    ] Fitting expression estimator for condition 1...
[2026-07-28 13:53:03,577] [INFO    ] Fitting expression estimator for condition 2...
[2026-07-28 13:54:09,210] [INFO    ] Updating 1 genes (0.0% of total) in existing sparse layers: kompot_ls_low_Young_smoothed, kompot_ls_low_Old_smoothed, kompot_ls_low_Young_to_Old_fold_change. Temporarily converting CSR->LIL->CSR.
[2026-07-28 13:54:09,250] [INFO    ] This run will have `run_id=2`.
[2026-07-28 13:54:09,311] [INFO    ] Condition 1 (Young): 2,917 cells
[2026-07-28 13:54:09,311] [INFO    ] Condition 2 (Old): 3,116 cells
[2026-07-28 13:54:12,376] [INFO    ] Fitting expression estimator for condition 1...
[2026-07-28 13:54:27,782] [INFO    ] Fitting expression estimator for condition 2...
[2026-07-28 13:55:32,035] [INFO    ] Updating 1 genes (0.0% of total) in existing sparse layers: kompot_ls_high_Young_smoothed, kompot_ls_high_Old_smoothed, kompot_ls_high_Young_to_Old_fold_change. Temporarily converting CSR->LIL->CSR.
[2026-07-28 13:55:32,075] [INFO    ] This run will have `run_id=3`.
[13]:
gi = adata.var_names.get_loc(gene)

def _smoothed(key):
    # per-gene smoothed expression is a layer
    v = adata.layers[f"{key}_{c1}_smoothed"][:, gi]
    return np.asarray(v.todense()).ravel() if hasattr(v, "todense") else np.asarray(v).ravel()

def _uncertainty(key):
    # posterior std is a per-cell obs column (shared across genes)
    return np.asarray(adata.obs[f"{key}_{c1}_std"], dtype=float)

cols = {
    "ls_factor = 2 (sharp), smoothed":     _smoothed("kompot_ls_low"),
    "ls_factor = 30 (smooth), smoothed":   _smoothed("kompot_ls_high"),
    "ls_factor = 2 (sharp), uncertainty":  _uncertainty("kompot_ls_low"),
    "ls_factor = 30 (smooth), uncertainty": _uncertainty("kompot_ls_high"),
}
for name, values in cols.items():
    adata.obs[name] = values

names = list(cols)
# Shared color scale within each row so the comparison is honest.
expr = np.concatenate([cols[names[0]], cols[names[1]]])
unc = np.concatenate([cols[names[2]], cols[names[3]]])
row_style = [
    dict(cmap="Spectral_r", vmin=np.nanmin(expr), vmax=np.nanmax(expr)),
    dict(cmap="magma", vmin=0, vmax=np.nanmax(unc)),
]

fig, axes = plt.subplots(2, 2, figsize=(8, 7))
for j, name in enumerate(names):
    row = j // 2
    sc.pl.embedding(adata, "umap", color=name, ax=axes[row, j % 2], show=False,
                    frameon=False, title=name, **row_style[row])
fig.suptitle(f"{gene}: higher ls_factor gives a smoother function with lower uncertainty", y=1.02)
plt.tight_layout()

The high-ls_factor panels (right) are visibly smoother and, in the bottom row, uniformly dark (near the bottom of the magma scale) — lower posterior uncertainty. The low-ls_factor panels (left) resolve finer spatial structure but light up in the bottom row, carrying more uncertainty. Default 10 sits between these extremes.
Resource Planning
Before a long or memory-heavy job, dry_run=True estimates memory, disk, and the fields that would be written — without running anything. The returned ResourcePlan carries total_memory_required, total_disk_required, is_feasible and a per-array requirements breakdown, so you can price two configurations against each other before committing to either.
The estimate resolves null_genes exactly as the run would, including the "auto" default, so the plan prices the run it describes. null_genes=2000 is passed below to make the configuration explicit, not because the default would be mispriced.
[14]:
plan = kompot.de(
    adata,
    groupby=GROUPING_COLUMN,
    condition1="Young",
    condition2="Old",
    layer=LAYER_FOR_EXPRESSION,
    obsm_key=DIMENSIONALITY_REDUCTION,
    fdr=kompot.FDRSettings(null_genes=2000),
    dry_run=True,
)
================================================================================
RESOURCE USAGE PLAN
================================================================================

System Resources:
  Memory: 530.26 GB available (of 754.57 GB total)
  Disk:   311.62 GB available at /tmp

Total Requirements:
  Memory: 31.76 GB (6% of available)

Memory Allocations:
  • Mellon precision matrix L (condition 1, 2,917/3,116 cells) (np.int64(2917), np.int64(2917)): 64.92 MB
  • Mellon precision matrix L (condition 2, 2,917/3,116 cells) (np.int64(3116), np.int64(3116)): 74.08 MB
  • Smoothed expression (condition 1) (8090, 18285): 1.10 GB → adata.layers['kompot_de_Young_smoothed']
  • Smoothed expression (condition 2) (8090, 18285): 1.10 GB → adata.layers['kompot_de_Old_smoothed']
  • Fold change (8090, 18285): 1.10 GB → adata.layers['kompot_de_Young_to_Old_fold_change']
  • Temporary matrices during predictions (batch_size=100) (100, 5000) + (100, 18285): 17.77 MB
  • Peak intermediate arrays during predictions (~25 arrays) 25×(8090, 18285): 27.55 GB
  • Function predictor covariances (per condition) (5000, 5000): 381.47 MB
  • Combined covariance matrix (5000, 5000): 190.73 MB
  • Cholesky decomposition (for Mahalanobis) (5000, 5000): 190.73 MB
  • Mahalanobis batch processing (batch_size=100) (100, 5000): 3.81 MB

Output Fields:
  adata.layers:
    - kompot_de_Young_smoothed [OVERWRITES run_id=1]
    - kompot_de_Old_smoothed [OVERWRITES run_id=0]
    - kompot_de_Young_to_Old_fold_change [OVERWRITES run_id=0]
  adata.var:
    - kompot_de_Young_to_Old_mahalanobis [OVERWRITES run_id=0]
    - kompot_de_Young_to_Old_mean_lfc [OVERWRITES run_id=0]
    - kompot_de_Young_to_Old_mahalanobis_local_fdr
    - kompot_de_Young_to_Old_is_de

Info:
  ℹ Null distribution will use 2000 additional genes (total: 18285 genes processed)
  ℹ Cell batching reduces memory: Each of 4 prediction operations uses ~17.77 MB temporary arrays instead of 1.40 GB (saving 1.39 GB).
  ℹ Prediction creates ~25 intermediate arrays of shape (8,090, 18285). These coexist at peak memory (27.55 GB) but are freed before completion.
  ℹ Mahalanobis computation processes 100 genes per batch. Reduce via gp=GPSettings(batch_size=...) to lower peak memory (currently 3.81 MB for batch arrays).

Warnings:
  ⚠ Results with result_key='kompot_de' already exist (run_id=1). Previous run: 2026-07-28T13:52:44.889145 comparing Young to Mid (null_genes=2000). Fields that will be overwritten: var.kompot_de_Young_to_Old_mahalanobis, var.kompot_de_Young_to_Old_mean_lfc, layers.kompot_de_Young_smoothed, layers.kompot_de_Old_smoothed, layers.kompot_de_Young_to_Old_fold_change and 2 more

================================================================================
STATUS: ⚠ FEASIBLE WITH WARNINGS - Proceed with caution
================================================================================
Cleanup
cleanup drops the large smoothed-expression layers but keeps adata.var statistics. Pass run_ids to target specific runs:
[15]:
kompot.cleanup(adata, run_ids=0, analysis_type="de")
[2026-07-28 13:55:33,277] [INFO    ] Cleaned up 3 field(s) from run 0:
[2026-07-28 13:55:33,278] [INFO    ]   layers (3 field(s)):
[2026-07-28 13:55:33,278] [INFO    ]     - kompot_de_Young_smoothed
[2026-07-28 13:55:33,279] [INFO    ]     - kompot_de_Old_smoothed
[2026-07-28 13:55:33,282] [INFO    ]     - kompot_de_Young_to_Old_fold_change
[2026-07-28 13:55:33,282] [INFO    ] Total: Cleaned up 3 field(s) across 1 run(s)
Where to go deeper
Smoothing expression functions — the estimator behind DE, covering
ls_factor, uncertainty, and subset-training for transfer/counterfactuals.DE with sample variance — robust significance across replicates.
Differential abundance — cell-state frequency changes.